Statistics Interview Questions
Statistics plays a crucial role in extracting meaningful information from quantitative data. It encompasses a range of methods and theories that enable us to gain valuable insights and make informed decisions in the presence of uncertainty. As you embark on your journey in Data Science, having a solid understanding of statistics will prove beneficial in effectively utilizing the potential insights from data. By employing statistical tools and techniques, we can identify underlying patterns and gain deeper insights from the data. For data scientists, having a strong grasp of statistics is essential, and during interviews, they may encounter a variety of questions, ranging from fundamental concepts to more advanced topics. Being well-prepared with statistical knowledge can significantly enhance one's performance and confidence in such interviews.
Ready to dive in? Then let's get started!
What is Statistical Learning?
Statistical Learning represents a relatively recent and rapidly evolving field within statistics that synergizes with the parallel advancements in computer science, particularly Machine Learning. It utilize rule-based programming, which formalizes the relationships between variables in a structured manner. Primarily focused on inferences, population analysis, and hypothesis testing, Statistical Learning often involves making specific assumptions that are subsequently validated once models are created.
Statistical Learning encompasses the process of extracting insights from training data and making predictions on unseen data. It involves a diverse set of tools aimed at effectively modeling and comprehending complex datasets. The formulation of Statistical Learning problems is remarkably versatile, allowing it to address a wide array of challenges across different domains. By embracing the principles of Statistical Learning, data scientists can derive valuable information from data and build robust predictive models to tackle real-world problems. The formulation of Statistical Learning problem is quite general. However, two main types of problems are that of:
- Regression Estimation
- Classification
Examples of Statistical Learning problems include:
- Predict the price of a stock in one year from now, on the basis of company performance measures and financial data.
- Estimate the amount of glucose in the blood of a diabetic patient, from the infrared absorption spectrum of that patient's blood.
- Identify the risk factors for prostate cancer, based on clinical and demographic variables.
What is the importance of statistics in Data Science?
Statistics plays a fundamental role in Data Science as it forms the bedrock for data analysis and interpretation. The concepts and principles of statistics enable data scientists to gain valuable insights from the data and conduct quantitative analyses effectively. Key statistical concepts such as probability distributions, statistical significance, hypothesis testing, and regression are vital tools in the data scientist's toolkit.
In the scope of Data Science, statistics is a powerful tool for tackling complex real-world problems and extracting meaningful patterns and trends from datasets. It facilitates the exploration and understanding of data, paving the way for the development of robust data models to validate predictions and inferences. At every stage of the Data Science cycle, from data exploration to model building and evaluation, statistical techniques play a crucial role.
A skilled statistician possesses the necessary expertise to excel in Data Science since the two fields are deeply intertwined. The application of statistics in Data Science empowers professionals to transform raw data into actionable insights, make data-driven decisions, and contribute significantly to the advancement of various industries and domains.
What is Statistical Modelling?
Statistical Modeling involves the application of statistical techniques to construct a representation of the data and conduct analysis to reveal relationships between variables or uncover valuable insights. This representation can take the form of a mathematical equation or a visual depiction, enabling data scientists to make predictions and draw meaningful conclusions about real-world phenomena.
By employing various Statistical Modeling techniques on the dataset they are studying, data scientists gain a deeper understanding of the information at hand and can interpret it more strategically. These models provide a structured framework to analyze complex data, identify patterns, and make informed decisions. Statistical Modeling is a powerful tool that empowers data scientists to extract valuable knowledge from data and generate predictions that contribute to solving real-world problems and optimizing various processes. There are three main types of statistical models:
- Parametric
- Nonparametric
- Semiparametric
The most common statistical modelling methods for analyzing data are categorized:
- Supervised Learning
- Unsupervised Learning
Supervised Learning techniques include Regression Models and Classification Models, while Unsupervised Learning techniques include Clustering Algorithms and Association Rules.
Different statistical techniques used in Data Science?
The primary goal of statistics is to provide a systematic and organized approach to explain and predict information from data. There is a wide array of statistical techniques available, ranging from simple to complex and tailored for specific purposes. These techniques serve as powerful tools for data analysis, enabling researchers, analysts, and data scientists to draw meaningful insights, uncover patterns, and make informed decisions based on empirical evidence.
Statistics plays a crucial role in various fields, such as science, business, economics, social sciences, healthcare, and more. It allows professionals to organize and analyze data, test hypotheses, make predictions, and draw inferences about populations based on samples. Whether it involves analyzing survey data, conducting experiments, or building predictive models, statistics forms the backbone of data-driven decision-making and is an essential component of the scientific method. By using statistical techniques effectively, researchers can draw valid conclusions, detect trends, and gain a deeper understanding of the world around us. Following are the most popular statistical techniques used in Data Science .
- Linear Regression
- Classification
- Resampling Methods
- Nonlinear Models
- Tree-Based Methods
- Unsupervised Learning
What is measure of central tendency?
A measure of central tendency is a statistical concept used to describe the central or typical value within a dataset. It aims to identify the central position of the data by providing a single value that represents the center point of the distribution. While it may not convey information about individual data points, it offers a concise summary of the overall dataset. This summary helps in understanding the central tendency of the data and allows for comparisons and analysis across different datasets.
Common measures of central tendency include the mean, median, and mode. The mean is the arithmetic average of all the values in the dataset, the median is the middle value when the data is arranged in ascending or descending order, and the mode is the value that appears most frequently in the dataset. Each of these measures offers a unique perspective on the central position of the data and can be useful depending on the nature of the dataset and the research question at hand.
Generally, the measure of central tendency of a dataset can be described using the following measures:
- Mean: the sum of all values divided by the total number of values.
- Median: the middle number in an ordered data set.
- Mode: the most frequent value.
Each of the above measures calculates the location of the central point using a different method. Choosing the best measure of central tendency depends on the type of data you have.
What do you understand by the term Normal Distribution?
The Normal Distribution, also known as the Gaussian or bell curve, is a fundamental probability function used to characterize the distribution of values in a variable. It represents a continuous probability distribution that exhibits symmetrical properties around the mean, creating a mirror-image pattern on both sides of the center. Extreme values occurring in the tails of the distribution are rare occurrences, making them highly improbable.
This statistical distribution is entirely determined by its mean and standard deviation, where the mean represents the central tendency of the data and the standard deviation measures the dispersion or spread of values around the mean. The majority of data points lie within one standard deviation from the mean, and as we move farther away from the mean, the probability of encountering extreme values decreases rapidly.
Due to its versatility and prevalence in numerous natural and artificial processes, the Normal Distribution finds extensive application in various scientific, engineering, and social science domains. It serves as a powerful tool for modeling real-world phenomena, analyzing data, making predictions, and calculating probabilities associated with specific regions of the bell curve. As a result, understanding the characteristics and implications of the Normal Distribution is essential for data scientists and statisticians to gain valuable insights and draw meaningful conclusions from data sets.
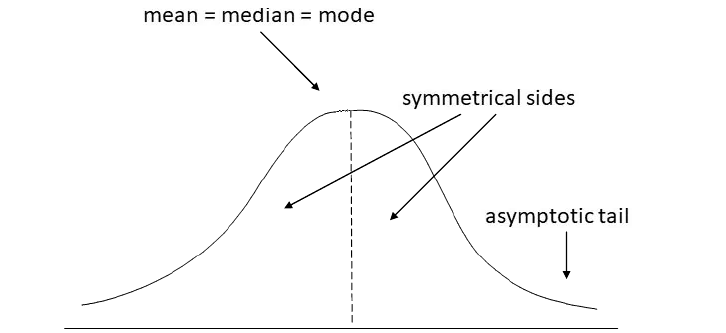
The Normal Distribution has:
- mean = median = mode
- Bell Shaped
- Symmetrical
- Tail extend indefinitely
What is Linear Regression?
Linear regression analysis is a powerful statistical method employed to forecast the value of a target variable (y) based on the values of one or more predictor variables (x). The target variable, also referred to as the response or dependent variable, represents the key outcome of interest that we seek to estimate or understand. Conversely, the predictor variable(s), known as the explanatory or independent variable(s), serve as the inputs used to forecast the variation in the target variable. By establishing a linear relationship between the dependent and independent variables, the linear regression model aims to find the best-fitting line that effectively captures the association between them. This model is particularly valuable for investigating causal connections between variables and making data-driven predictions based on historical observations. However, it is crucial to carefully evaluate the assumptions and limitations of linear regression to ensure the accuracy and reliability of the predicted outcomes.
For example, Linear regression analysis can be used to quantify the relative impacts of age, gender, and diet (independent variables (x)) on height (the dependent variable (y)).
A linear regression line has an equation of the form:
Here X is the predictor variable (independent variable) and Y is the response variable (dependent variable). The slope of the line is b, and a is the intercept (the value of y when x = 0).
There are two types of linear regression:
- Simple Linear Regression
- Multiple Linear Regression
A Simple Linear Regression model has only one predictor or independent variable, while a Multiple Linear Regression model has two or more predictor or independent variables.
What is Bias in a Model?
Bias in machine learning refers to the disparity between the average predicted value of a model and the true or expected value of the target variable. It represents the extent to which the model tends to deviate from the actual data. A high-bias model exhibits inflexibility and oversimplification, resulting in limited capacity to capture complex patterns in the data, thus leading to underfitting. On the other hand, a low-bias model is more flexible and has the ability to closely match the training data, indicating a better fit. Striking the right balance between bias and variance is crucial in machine learning, as excessively high or low values of bias can impact the model's ability to generalize to new, unseen data. By understanding and managing bias, data scientists can optimize model performance and enhance the accuracy of predictions.
What is variance in a model?
Variance describes how much the prediction would vary if the model was trained on a different dataset , drawn from the same population. It simply means that if a Machine Learning model is predicting with an accuracy of "x" on training data and its prediction accuracy on test data is "y" then
Variance = x - yBias Vs. Variance
Bias and Variance can be decomposed from the expected error of the trained model, given different samples drawn from a training distribution. Bias and variance are inversely connected.
- Models with high bias will have low variance.
- Models with high variance will have a low bias.
What is the difference between covariance and correlation?
These are two statistical concepts that are used to determine the relationship between two random variables.
- Covariance shows us how the two variables vary from each other. This means that it indicates the direction of the linear relationship between variables.
- Correlation shows us the relationship between the two variables and how are they related. It not only shows the direction of the relationship, but also shows how strong the relationship is.