Regression Analysis
Regression analysis is a robust set of statistical methods employed to model and examine the relationships between a response variable (dependent variable) and one or more predictor variables (independent variables). It serves as a powerful tool for analyzing the association between variables and identifying the extent to which each predictor variable influences the response variable.
By using regression analysis, researchers can statistically disentangle the effects of multiple predictors and determine which variables significantly impact the response variable, thus facilitating the interpretation and understanding of complex relationships within the data. This analytical approach is widely utilized in various fields, including economics, social sciences, epidemiology, and engineering, where it aids in making evidence-based decisions, formulating predictive models, and drawing meaningful conclusions from data-driven analyses. Regression analysis is used for three types of applications:
- Finding out the effect of independent variables on dependent variable.
- Finding out the change in dependent variable with respect to one or more independent variable.
- To find out upcoming trends.
Regression algorithms are essential for any Machine Learning problem that involves continuous numbers. It is fall under the family of Supervised Machine Learning algorithms which is a subset of machine learning algorithms. These algorithms may be linear as well as non-linear. We'll discuss them in detail in the following sections.
- Simple linear regression
- Multiple linear regression
- Ordinary Least Squares regression

Simple linear regression
Simple Linear Regression is a fundamental and widely used statistical technique belonging to the family of Regression algorithms. It enables researchers to succinctly summarize and analyze the relationship between a single dependent variable (response variable) and a solitary independent variable (predictor variable). In this approach, one of the variables, represented by x, assumes the role of the predictor or independent variable, while the other variable, denoted as y, plays the crucial role of the response or dependent variable.
Through Simple Linear Regression, analysts can model and quantify the influence of the predictor variable on the response variable, enabling them to assess the strength and direction of the association. This method holds significant importance in various research domains, including economics, social sciences, business analytics, and engineering, as it facilitates the identification of patterns, prediction of outcomes, and insights into the dependencies between variables.
You can use simple linear regression for:
- How strong the relationship is between two variables (x and y) .
- The value of the dependent variable at a certain value of the independent variable.
A linear regression is where the relationships between your variables (x and y) can be represented by a straight line.
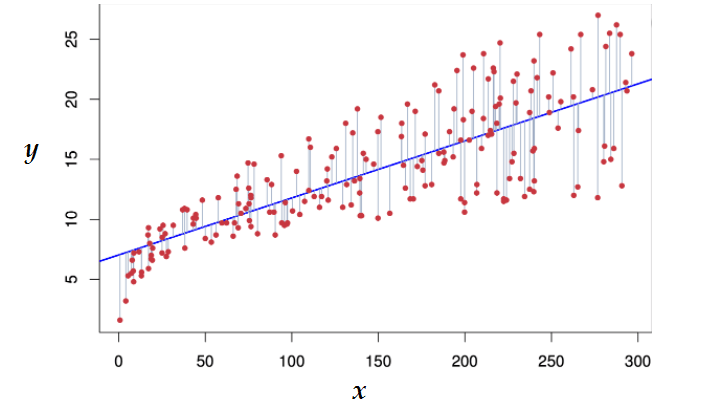
After looking at the above scatter plot you can understand:
- The direction
- The strength
- The linearity
The equation that describes how y is related to x is known as the regression model . The simple linear regression model is represented by:
y = ß0 +ß1x+e- y is the mean or expected value of y for a given value of x.
- ß0 is the y-intercept of the regression line.
- ß1 is the slope.
- x is the independent variable (the variable expect is influencing y).
- e is the error of the estimate.
Multiple linear regression
Multiple Linear Regression serves as a valuable extension of the simple linear regression technique, providing a more sophisticated statistical approach to modeling relationships between variables. This method involves using multiple independent variables (predictors) to predict the outcome of a dependent variable (response) by fitting a linear equation to observed data. Multiple linear regression enables researchers to assess the collective impact of several predictors on the response variable and quantify their relative contributions to the total variance in the model.
This versatile approach is particularly useful when studying complex relationships and interactions among multiple factors. By employing multiple linear regression, analysts can gain deeper insights into the underlying patterns, make more accurate predictions, and uncover the most influential variables affecting the dependent variable. Its widespread use spans various fields, including finance, social sciences, healthcare, and market research, where it plays a vital key in understanding and predicting real-world phenomena.
Example:The height of a child can depend on the height of the mother, the height of the father, nutrition, and environmental factors.
Ordinary Least Squares regression
Ordinary Least Squares (OLS) regression is a widely utilized and highly effective regression analysis technique that estimates the association between one or more independent variables (predictors) and a dependent variable (response).
The fundamental principle behind OLS is to determine the best-fitting line by minimizing the sum of the squares of the differences between the observed and predicted values of the dependent variable. The goal is to find the line that best captures the relationship between the predictor variables and the response variable. By minimizing the sum of these squared differences, OLS ensures that the line fits the data points as closely as possible. This method is particularly suitable for linear relationships, allowing researchers to obtain coefficients that quantify the impact of each predictor variable on the response variable.
Conclusion
Regression analysis is a statistical method used in supervised machine learning to model the relationship between a dependent variable and one or more independent variables. The goal of regression is to predict continuous numerical values based on the input features and find the best-fitting line or curve that represents the relationship between the variables.