Measures of Central Tendency
A measure of central tendency assumes a key role in the field of quantitative data analysis. It serves as a crucial component that seeks to unravel the essence of a dataset by pinpointing its center point or typical value, thereby encapsulating the collective nature of the data in a singular value. The primary objective of a measure of central tendency is to offer the most precise and representative depiction of the entire dataset, encapsulating its core characteristics.
The process of selecting the most appropriate measure of central tendency hinges on the nature and distribution of the dataset at hand. Different measures, such as mean, median, and mode, each cater to distinct scenarios, and the choice of the best measure is contingent upon the dataset's characteristics and the specific insights sought from the data. By adeptly employing the suitable measure of central tendency, researchers can gain a profound understanding of the data's central focus, enabling them to make informed decisions, derive valuable insights, and uncover the inherent patterns and trends that underlie the quantitative information at their disposal. The three most common measures of central tendency in statistics are:
- Mean
- Median
- Mode
Mean
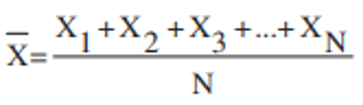
The arithmetic mean, often referred to as the simple average, stands as the prevailing and widely adopted measure of central tendency. Computed as the sum of all values in the dataset divided by the total number of values, the arithmetic mean encapsulates the essence of the data's central focus, providing a representative and balanced summary of the dataset. Consider a random variable x and a data set S = {x1, x2, ..., xn} of size n, comprising possible values of x.
The mean is calculated by summing up all the values {x1, x2, ..., xn} in the dataset and then dividing this sum by the total number of values (n). The arithmetic mean thus serves as a fundamental tool for understanding the overall magnitude and central distribution of data points, assisting researchers in drawing valuable insights, making data-driven decisions, and uncovering the fundamental patterns and tendencies that characterize the data set under investigation.
Example:
Calculate Arithmetic Mean from the data showing marks of students in a class in a Physics test: 32, 48, 53, 71, 59.
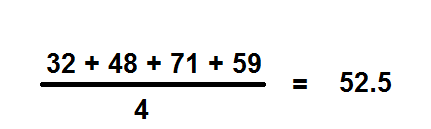
The average mark of students in the Physics test is 52.5.
Median
The median represents a crucial measure of central tendency, distinct from the arithmetic mean, which highlights the middle value of a dataset when arranged in either ascending or descending order. The median serves as a robust alternative to the mean, particularly when dealing with datasets that may contain outliers or skewed distributions, as it is not influenced by extreme values. To calculate the median, the dataset is first arranged in ascending or descending order, after which the middle value is extracted.
In scenarios where the dataset contains an even number of elements, the median is determined by taking the mean of the two middle values. This approach ensures that the median appropriately represents the central position of the dataset and provides a reliable insight into the data's typical value. By employing the median as a measure of central tendency, researchers can effectively account for the influence of extreme values and obtain a more robust understanding of the central distribution of data points, thereby maintaining a well-rounded and comprehensive analysis of the dataset.
Suppose you have a dataset of five values:
Arrange the values in ascending/descending order, i.e. smallest to largest or largest to smallest.
Here, there are only five values. So, the middle value is 3rd one. That is 32.
Median of the above dataset is 32.Suppose you have a dataset of six values:
Arrange the values in ascending/descending order.
Here, there are six values and the dataset not have a single middle value . So, 3rd and 4th position are the middle of dataset. So, you have to take the 3rd and 4th values in your data set and average them to get a median.
Third and Fourth values are : 32 and 36.
Average of 32 and 36 is : (32+36)/2= 34.
Median of the above dataset is 34.Mode
The mode stands as a significant measure of central tendency that denotes the most frequently occurring value in a dataset. When analyzing a dataset, the mode represents the value that appears most frequently, providing valuable insights into the dataset's dominant or prevalent characteristic. If there are no repeating values in the dataset, it is referred to as having no mode.
It's worth noting that a dataset may exhibit different modes depending on its characteristics. In cases where only one value occurs most frequently, the dataset has a single mode. Conversely, a dataset might possess multiple modes when two or more values occur with the same highest frequency, creating multiple peaks in the distribution.
The mode is particularly useful when dealing with categorical or discrete data, where the repetition of specific values is common. By identifying the mode, researchers gain a clear understanding of the data's most prevalent attributes, making it a valuable tool for summarizing data and detecting patterns.
Suppose you have a dataset of some values:
Arrange the values in ascending/descending order.
Here the value 32 is occurring three times and the value 21 occurring two times. Mode is the most frequently occurring value in the dataset. 32 is the most frequently occurring value in the dataset.
Mode of the above dataset is 32.Conclusion
It's important to keep in mind that the mode is not always suitable for datasets with continuous or interval data, as there may not be repeating values, making the concept of mode less applicable in such scenarios. Nevertheless, for datasets where it is relevant, the mode offers essential insights into the most common values, enabling researchers to make informed decisions and interpret the underlying characteristics of the data.