Measures of the Spread of Data
Summarizing a dataset serves as a crucial step in data analysis, particularly when dealing with large datasets that can be overwhelming to comprehend in their entirety. While Measures of Central Tendency offer valuable insights into the typical or central values of a dataset, they alone do not provide a complete picture of the data distribution. To fully understand the dataset's characteristics, it is essential to complement Measures of Central Tendency with Measures of Spread, also known as measures of dispersion. These measures elucidate the degree of variability and extremity exhibited by the values within the dataset. By quantifying the spread of data, Measures of Spread shed light on how scattered the values are, and how much they deviate from the mean value.
This comprehensive approach to summarizing data allows researchers to gain a comprehensive understanding of the dataset's distribution, identify patterns and outliers, and discern the range and diversity of values present. Embracing both Measures of Central Tendency and Measures of Spread ensures a more comprehensive and accurate portrayal of the dataset, enabling researchers to make well-informed decisions and draw meaningful insights from the data at hand.
There are several basic measures of spread used in statistics. The most common are:
- Range
- Inter-Quartile Range (IQR)
- Variance
- Standard Deviation
Range
The Range is Define and calculate the range of a dataset. It is the difference between the smallest value in a dataset (Minimum) and the largest one (Maximum).
Range = maximum - minimumSuppose you have a dataset of some values:
Minimum value is : 12
Maximum value is : 94
Range of dataset is : 94 - 12 = 82
Quartile and Inter-Quartile Range (IQR)
Quartile
Quartiles are the values that divide a dataset into quarters .
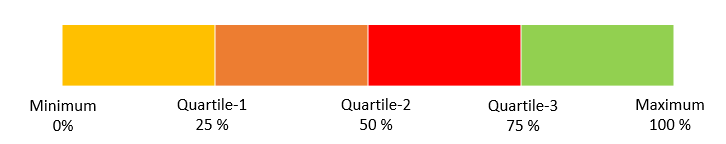
Inter-Quartile Range (IQR)
The Inter-Quartile Range (IQR) is a significant and informative measure of variability, rooted in the concept of dividing a dataset into quartiles. This process involves segregating the dataset into four equal parts, with each quartile representing 25% of the data. The First Quartile (Q1), also referred to as the lower quartile, marks the boundary below which 25% of the data falls. The Second Quartile (Q2), commonly denoted as the median, acts as the middle value that divides the dataset into two halves, with 50% of the data above and 50% below this value. The Third Quartile (Q3), known as the upper quartile, serves as the dividing line above which 75% of the data resides.
By using the IQR, researchers gain a robust understanding of the spread and distribution of data points within the middle 50% of the dataset, providing valuable insights into the central tendencies while reducing the influence of outliers. The utilization of quartiles, particularly the IQR, allows for a more comprehensive and nuanced assessment of the dataset's variability and aids in identifying the range within which the majority of data points lie. Embracing this approach empowers researchers to gain a comprehensive grasp of the dataset's characteristics, facilitating more informed decision-making and robust data analysis.
The interquartile range is found by subtracting the Q1 value from the Q3 value.
IQR = Q3 - Q1How to find Inter-Quartile Range?
Suppose you have a dataset:
Put the numbers in order.
Find the median of dataset
Total eleven numbers in the dataset. So, the median is sixth value:
Median value is : 60Separate the numbers above and below the median.
In the above case Q2 is 60 . So, find the Q1 and Q3.
Q1 is the median of first half of dataset and Q3 is the median of second half of the dataset.
Inter-Quartile Range (IQR) = Q3 - Q1
Inter-Quartile Range (IQR) = 60
Variance
The Variance measures the average degree to which each point differs from the mean. In order to find out the variance, first calculate the difference between each point from the mean, square it , and then average the result.
How to calculate the Variance?
- Step-1 : Find the mean of the dataset.
- Step-2 : Calculate difference from Mean.
- Step-3 : Square each value.
- Step-4 : Average it.
Suppose you have a dataset:
Step-1 : Find the mean of the dataset
First, you have to find the mean of the dataset.
Mean of the above dataset is : 394
Step-2 : Calculate difference from Mean
Next step is to calculate the difference of each values in the dataset from the Mean value:
Dataset : 600, 470, 170, 430, 300
Step-3 : Square each value
Square each value .Step-4 : Average it
Average the result .Variance of the above dataset is : 21704
Standard Deviation
Standard Deviation represents a crucial measure of dispersion, providing valuable insights into the spread or variability of data points within a dataset. This statistical metric quantifies the extent to which individual values deviate from the mean, thereby capturing the degree of scatter or dispersion of data around the average.
To calculate the Standard Deviation, researchers begin by computing the variance, which involves finding the average of the squared differences between each data point and the mean. The variance characterizes the overall spread of data, but its unit of measurement is not directly interpretable, making it less intuitive for understanding the actual dispersion in the dataset.
To address this, the Standard Deviation is derived by taking the square root of the variance, effectively converting it back to the original unit of measurement and providing a more interpretable metric. A smaller Standard Deviation indicates that the data points tend to be close to the mean, suggesting less variability, while a larger Standard Deviation implies greater spread and greater dispersion of data around the mean.
Standard deviation (S) = square root of the variance .Calculate the Standard deviation of the following dataset:
Variance of the above dataset is : 21704
Standard deviation : square root of (21704) = 147
Conclusion
Researchers gain a comprehensive understanding of the distribution and variability of the data, aiding in the identification of patterns, outliers, and the level of uncertainty associated with the data points. This measure is fundamental in various fields, such as finance, natural sciences, and social sciences, where it is used to assess risk, model uncertainty, and analyze the consistency and stability of data trends. Embracing the Standard Deviation as a measure of dispersion enhances data analysis, promotes robust decision-making, and enables researchers to derive meaningful insights from their datasets.