pandas - Python Data Analysis Library
Pandas is an open-source library that provides powerful tools for data analysis, cleaning, exploration, and manipulation in Python. Its main data structures are Series and DataFrame, akin to R's data frame, with Series representing one-dimensional labeled arrays and DataFrame offering a two-dimensional tabular style data format with column and row indexes. Developers can import data from various file formats and perform a range of data manipulation operations, including cleaning, reshaping, summarizing, grouping, and merging datasets.
Importing Pandas DataFrame module
When dealing with an extensive number of function calls to pandas, repeatedly writing pandas.x() can be cumbersome and reduce code readability. As a best practice, it is more convenient to import the library under the abbreviated alias pd. This enables the usage of pandas functions with a more concise syntax, such as pd.x(), making the code more manageable and enhancing clarity.
Get your data into a DataFrame
There are several ways you can use to take a standard python datastructure and create a panda's DataFrame.
Pandas DataFrame from Python List
Pandas DataFrame from Python Dictionary
Working with DataFrame Columns and Rows
Select Columns from DataFrame
From daraframe select only Name and Grade Columns
Select Rows from DataFrame
Pandas daraframe uses the loc() method to return one or more specified row(s).
Select Multiple rows from DataFrame
Adding Named Indexes
In dataframe you can name your own indexes by using index argument .
Retrieve data using Named Index
Dataframe from numpy ndarray
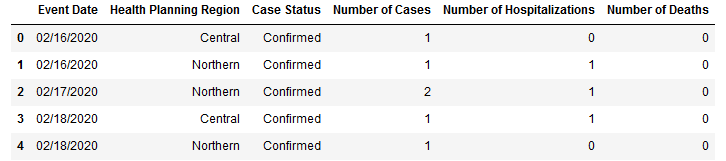
View the first or last N rows
- DataFrame head() method return first 5 rows
- DataFrame tail() method return last 5 rows
You can pass number of rows as argument
Loading Data from files
Pandas provides various functions, such as read_csv for comma-separated values, read_excel for Microsoft Excel spreadsheets, and read_fwf for fixed-width formatted text, to efficiently read data from external files. These functions facilitate the process of importing data into pandas DataFrames, enabling seamless data analysis and manipulation within the Python environment.
Saving a DataFrame
Read data and saving a DataFrame to a CSV file.
Find columns data types
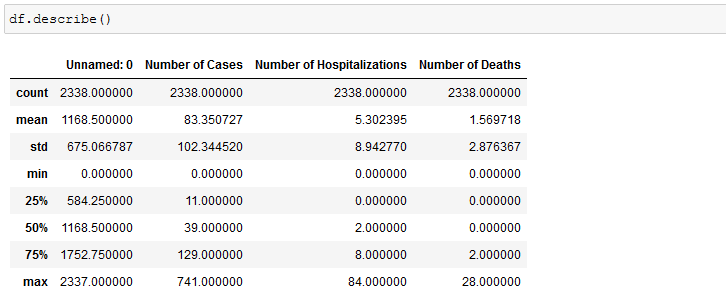
Statistical Summary of Data
Pandas describe() method output a a brief statistical summary of the numeric columns in the data, including descriptive statistics of the central tendency and dispersion.
Copy DataFrame to another DataFrame
Count rows in a DataFrame
Conclusion
Pandas is a Python Data Analysis Library that offers robust tools for data manipulation, exploration, and analysis. It provides functions like read_csv, read_excel, and read_fwf to efficiently read data from various external file formats, allowing users to work with data in a convenient and intuitive manner.