R-Squared in Regression Analysis
Upon completing the construction of a Machine Learning model, a crucial task ensues - the careful evaluation of the model's fit to the underlying data. In this pursuit, R-squared emerges as an indispensable statistical measure, adeptly gauging the proximity of the data points to the carefully fitted regression line. This evaluation metric, expressed as a percentage ranging from 0 to 1, encapsulates the degree to which the variation in the data finds explication in the relationship between the two variables under consideration.
A high R-squared value signifies that a substantial proportion of the data points closely adhere to the regression line, illustrating a strong association between the variables. Conversely, a lower R-squared value indicates a less pronounced relationship, signifying that a considerable portion of the data variation remains unaccounted for by the model's predictive capabilities. By utilizing the R-squared metric, data scientists attain an all-encompassing grasp of the model's capacity to elucidate the patterns and trends within the data, thereby facilitating the selection of models that accurately capture the underlying relationships and empowering the derivation of data-driven insights and informed decision-making.
R-squared, an integral statistical measure, unveils the essence of the relationship between the dependent and independent variable(s), quantifying the proportion of variance in the dependent variable that finds explanation in the independent variable(s). This comprehensive assessment signifies the extent to which the predictive capabilities of the model account for the variability within the data, elucidating the model's efficacy in capturing the underlying patterns and trends.
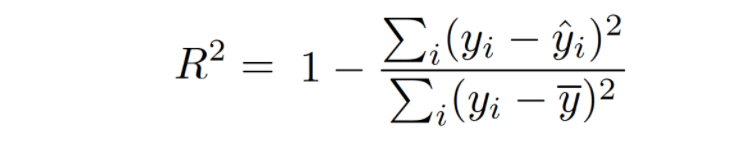
The computation of R-squared involves a careful comparison between the Residual sum of squares (SSres), reflecting the cumulative squares of differences between actual and predicted values by the linear regression model, and the total sum of squares (SStot), representing the cumulative squares of differences between actual values and the mean of the dependent variable. By embracing the residuals - the differences between observed and predicted values - researchers gain a profound understanding of the predictive errors and their collective impact, enabling them to discerningly unravel the unexplained variation within the data.

The R² is calculated by dividing sum of squares of residuals from the regression model (SSres) by total sum of squares of errors from the average model (given by SStot ) and then subtract it from 1.
R-squared is always between 0 and 100%:- 0% indicates that a low level of correlation, meaning a regression model that is not valid, but not in all cases.
- 100% indicates that two variables are perfectly correlated, i.e., with no variance at all.
R-squared manual calculation
R-squared using sklearn.metrics
Limitations of R-Squared :
R-squared does not indicate whether a regression model is adequate. You can have a low R-squared value for a good model, or a high R-squared value for a model that does not fit the data.
Conclusion
This statistical measure serves as a powerful guidepost in the model evaluation journey, empowering analysts to fine-tune their models, utilizing the full potential of data-driven insights, and steering their endeavors towards the attainment of a more comprehensive understanding of the relationships between variables.