What is Adjusted R-Squared
Adjusted R-Squared, a sophisticated refinement of the conventional R-Squared metric, emerges as a powerful tool in the scope of model evaluation, thoughtfully designed to address the impact of incorporating new predictors into the analysis. As new predictors are introduced, the Adjusted R-Squared dynamically adapts, either ascending or descending, based on the extent to which these predictors enhance the model's performance. This insightful adjustment transcends the limitations of the conventional R-Squared, which solely captures the proportion of variance explained by the independent variable(s).
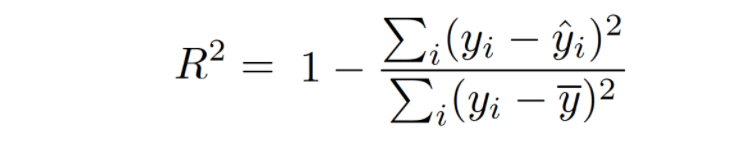
By comparing the Residual sum of squares (SSres) against the Total sum of squares (SStot), R-Squared offers a comprehensive glimpse into the model's ability to elucidate the data's variability. Computed by dividing the sum of squares of residuals from the regression model by the total sum of squares of errors from the average model and then subtracting this result from 1, R-Squared yields a refined and quantifiable measure of the model's predictive prowess. Through its apt and perceptive adjustment, Adjusted R-Squared deftly assesses the incremental value of new predictors, discerningly penalizing the addition of irrelevant or redundant features, and thereby steering researchers towards the selection of the most influential and meaningful predictors.
In stark contrast to the conventional R-squared, which remains indifferent to the number of predictors used, the Adjusted R-squared emerges as a discerning and sensible evaluator, keenly penalizing the inclusion of irrelevant or redundant features that bear no meaningful impact on predicting the target variable. This astute metric carefully considers the count of independent variables deployed in the prediction process, paving the way for a more comprehensive and equitable assessment of the model's predictive prowess.
By adjusting its value based on the number of predictors, Adjusted R-squared elevates the model evaluation process to a higher echelon, guiding researchers towards the selection of the most influential and pertinent predictors while discouraging the incorporation of superfluous variables. This refined adjustment equips data scientists with a powerful and informed tool, maintaining the curation of more parsimonious models that strike an optimal balance between predictive accuracy and parsimony. The Adjusted R-squared thus emboldens practitioners to embark on a data-driven journey, steering them towards the attainment of an optimized and robust solution while guarding against the pitfalls of overfitting or excessive complexity, ultimately promoting the precision and integrity of predictive analyses in diverse domains.
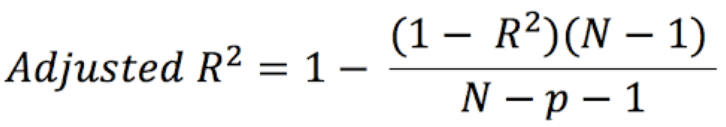
where,
- N = number of records in the data set.
- p = number of independent variables.
For a simple representation, you can rewrite the above formula like the following:
Adjusted R-squared = 1 — (x * y)where,
- x = 1 — R Squared
- y = (N-1) / (n-p-1)
Adjusted R-squared can be negative when R-squared is close to zero.
Adjusted R-squared value always be less than or equal to R-squared value.
Adjusted R-squared manual calculation
Adjusted R-squared using sklearn.metrics
Conclusion
This sophisticated metric fortifies the model evaluation process, guiding practitioners in honing the model's accuracy and precision, empowering data-driven decisions, and unlocking the true potential of predictive analytics in diverse domains.