How to calculate Inter-Quartile Range (IQR)
The Inter-Quartile Range (IQR) is a valuable statistical measure designed to gauge the dispersion or spread of the middle 50% of a dataset. It digs into the distribution's central region, effectively sidestepping the influence of outliers, which makes it a robust tool for characterizing the variability within the data.
The IQR is computed by calculating the difference between the 75th percentile, also known as the third quartile (Q3), and the 25th percentile, often referred to as the first quartile (Q1). The quartiles divide the data into four equal parts, where Q1 represents the data point below which the first 25% of the dataset lies, and Q3 represents the data point below which the first 75% of the dataset lies.
IQR = Q3 – Q1Interquartile Range of a single array
By considering only the middle 50% of the data, the IQR aptly encapsulates the majority of observations, offering a reliable indication of the range where the bulk of the data resides. Its resistance to extreme values, especially outliers, renders it less sensitive to the presence of these influential data points, setting it apart from other dispersion measures such as the standard deviation.
Interquartile Range of a single column in a DataFrame
Interquartile Range of multiple columns in a DataFrame
If you want to find Inter-Quartile Range of multiple columns in a DataFrame, you have to define function to calculate interquartile range of a single column in the DataFrame and then pass multiple column name to that DataFrame.
If you want to find out Inter-Quartile Range of all columns in a DataFrame:
How to Validate?
Above coding is find the IQT from scratch. If you want to save your time, you can use iqr() function from scipy.stats.
The IQR plays a vital role in outlier detection. Observations that lie significantly below Q1 - 1.5 * IQR or above Q3 + 1.5 * IQR are commonly classified as outliers. This empirical rule, known as the Tukey's fences, provides a straightforward and widely-used method to identify potential outliers in a dataset.
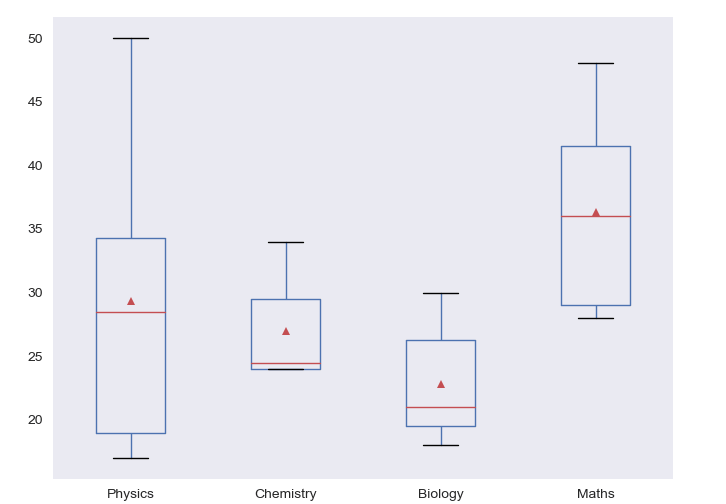
Visualization
Let’s plot the 25th percentile , the 50th percentile (median) and the 75th percentile of the DataFrame.
Conclusion
The Inter-Quartile Range emerges as an indispensable tool in exploratory data analysis, offering a nuanced understanding of the central distribution and highlighting the potential presence of outliers. It continues to be a valuable asset in statistical analysis, allowing researchers and analysts to gain deeper insights into their datasets and make informed decisions with greater confidence.