Metrics To Evaluate Machine Learning Algorithms
The process of evaluating a model stands as the vital cornerstone in constructing a triumphant Machine Learning endeavor. The fundamental aim of this evaluation is to discerningly contrast the predictions generated by the trained model with the actual data, engendering a profound comprehension of the model's performance. The resulting insights, gleaned from this evaluative process, not only furnish a comprehensive gauge of the model's efficacy but also facilitate seamless communication of its outcomes to the intended audience.
As diverse machine learning models necessitate distinct evaluation approaches, a plenitude of error metrics exists to cater to this need. In the domain of regression models, three predominant evaluation metrics assume prominence, each ingeniously tailored to assess the performance of these models with exceptional acumen.
These metrics, through their adeptness in quantifying the model's predictive prowess, unlock the potential to fortify the foundation of successful and data-driven decision-making endeavors.There are three evaluation metrics that are frequently used for evaluating the performance of a regression model. They are:
- Mean Squared Error (MSE)
- Root Mean Squared Error (RMSE)
- Mean Absolute Error (MAE)
Mean Squared Error (MSE)
Mean Squared Error (MSE) stands as a fundamental and prevalent evaluation metric in the domain of regression analysis, encompassing the statistical measurement of predictive accuracy. Its definition elucidates its essence as the Mean or Average of the squares of discrepancies between the actual and estimated values. By quantifying the squared differences between predicted and actual target variables for each data point and subsequently computing their average, MSE unveils the model's proficiency in approximating the true values. It captures the magnitude of errors and maintains a comprehensive understanding of the model's precision in mapping the underlying relationships within the data.
This evaluation metric serves as an invaluable tool for model selection and refinement, as its non-negative nature ensures that larger errors receive proportional weightage, compelling the model towards enhanced precision. The desirability of a lower MSE value is underscored, as it signifies a closer proximity to the true values, reaffirming the model's efficacy in rendering accurate predictions and facilitating well-informed decision-making endeavors.
To understand it better, let us take an example of actual demand and predicted demand for a brand of Mineral Water in a shop.
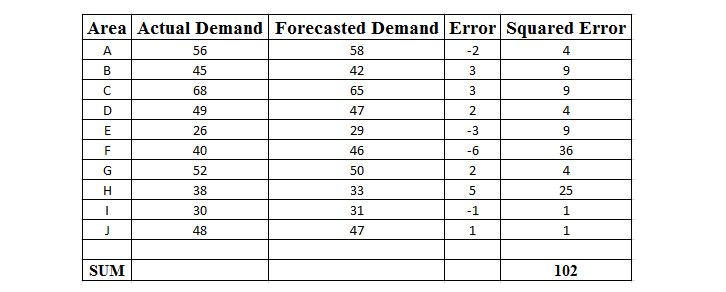
Square of the difference between the predicted and actual = 102
Number of data points = 10
Mean Squared Error (MSE) = 102/10 = 10.2
An ideal Mean Squared Error (MSE) value is 0.0, which means that all predicted values matched the expected values exactly. MSE is most useful when the dataset contains outliers , or unexpected values (too high values or too low values).
Mean Squared Error manual calculation
Mean Squared Error using sklearn
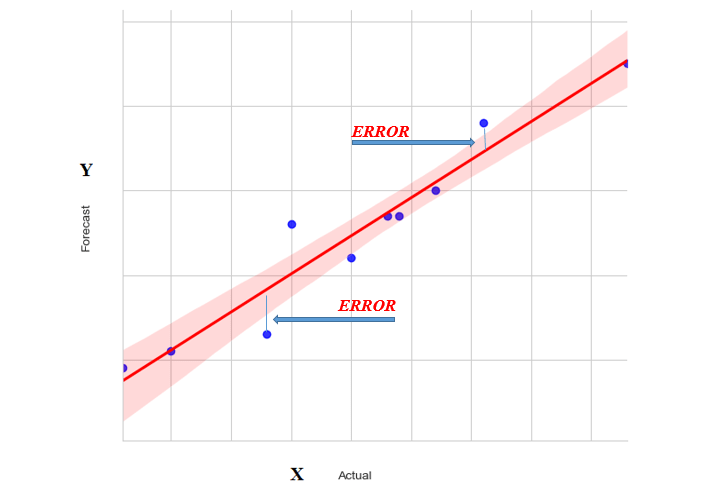
In the above diagram, forecasted values are points on the red line and actual values are shown by blue small circles. Error in prediction is shown as the distance between the data point and fitted line. Mean Squared Error for the line is calculated as the average of the sum of squares for all data points.
Root Mean Squared Error
Root Mean Square Error (RMSE) is a significant and widely-adopted metric in model evaluation, embodying a refined and nuanced approach to assessing predictive performance. As the square root of Mean Squared Error (MSE), RMSE introduces an additional layer of sophistication in gauging the accuracy of the model. By taking the square root of the MSE, RMSE effectively reverts the error metric to its original scale, aligning it with the actual units of the target variable. This transformation imbues the RMSE with interpretability, enabling analysts to comprehend the magnitude of prediction errors in real-world terms, thus enhancing the clarity of results.
By using the RMSE, data scientists gain a comprehensive understanding of the model's predictive precision, ensuring that errors are not only captured but also expressed in a manner conducive to intuitive interpretation and decision-making. This comprehensive measure empowers researchers to make informed judgments, selecting models that not only minimize predictive discrepancies but also uphold a profound level of accuracy when measured against the original data domain.
RMSE = sqrt(MSE)An ideal Root Mean Square Error (RMSE) value is 0.0, which means that all prediction values matched the expected values exactly.
Root Mean Squared Error manual Calculation
Root Mean Squared Error using sklearn
Mean Absolute Error (MAE)
Mean Absolute Error (MAE) represents a crucial evaluation metric in the field of model assessment, encapsulating a comprehensive measure of the predictive accuracy. Computed as the summation of the absolute differences between actual and predicted values, MAE deftly gauges the extent of the model's deviations without considering the directionality of errors. This unique attribute endows MAE with an inherent robustness, effectively sidestepping the influence of negative signs in discrepancies, thus providing a more inclusive and equitable representation of the prediction errors.
By focusing solely on the magnitudes of deviations, rather than their directional aspects, MAE offers an unbiased appraisal of the model's precision, equipping researchers and practitioners with a transparent and straightforward metric to guide their decision-making endeavors. The MAE's effectiveness lies in its capacity to provide an intuitive understanding of the average error between predictions and actual values, permitting an in-depth comprehension of the model's performance across the entire dataset. As a key player in the array of model evaluation tools, MAE stands as a beacon of clarity and objectivity, empowering analysts to unravel the true essence of predictive errors and steer their efforts towards data-driven solutions with heightened precision.
MAE = Expected values – Predicted valuesMean Absolute Error manual calculation
Mean Absolute Error using sklearn
An ideal Mean Absolute Error (MAE) value is 0.0, which means that all prediction values matched the expected values exactly.
Full Source: - MSE, RMSE and MAEThe results of the three evaluation metrics ( MSE, RMSE and MAE ) are the same in both methods . You can use any method (manual or sklearn ) according to your convenience in your Regression Analysis .
Conclusion
As a key component of the model evaluation toolkit, MSE empowers data scientists and analysts to discerningly assess the efficacy of regression models, enabling them to select the most suitable and precise model for a given problem domain. By striving for an MSE value close to zero, practitioners can strive for models that best capture the underlying relationships within the data, thereby promoting the advancement of data-driven solutions across various industries and domains.