Pandas dataframe.groupby()
The 'groupby' statement in a Pandas DataFrame is a powerful operation that orchestrates the grouping of rows sharing similar values into concise summary rows, thereby enabling meaningful data aggregation and analysis. This operation is akin to posing inquiries such as "determine the count of Apples that Steve possesses" and distilling the results into a concise and informative format.
By employing the 'groupby' statement, data analysts and scientists can effectively segment and organize the dataset based on specific criteria, transforming an unwieldy dataset into a structured and intelligible representation. This functionality proves indispensable when dealing with large datasets and seeking to gain insights into specific subsets of the data.
Lets' create DataFrame with values.
Here you can see 3 names (Doe, Mike and Steve) have different kind of fruits (Apple, Orange and Grapes). So, you can have some operations on these tables using DataFrame groupby statement.
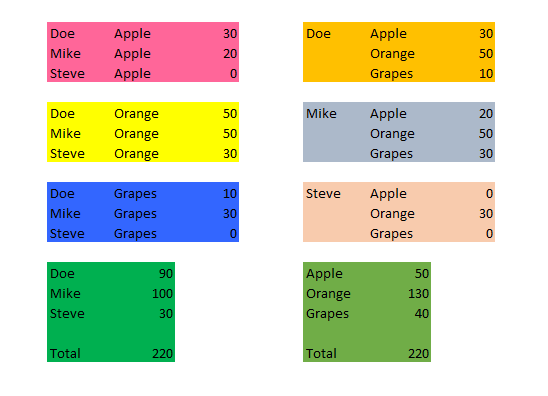
In the above image you can see some results from the above DataFrame. So, lets try to get the above result using DataFrame group by operation.
The 'groupby' statement synergizes seamlessly with various aggregate functions, ranging from fundamental statistical computations (e.g., sum, count, mean, min, max) to more complex custom operations. When combined, these aggregate functions can be applied to the grouped data, providing comprehensive summaries and revealing meaningful patterns that might otherwise remain concealed.
Apply reset_index()
Also, you get another result to change the groupby order:
The ability to group the DataFrame by one or more columns opens up a world of possibilities for dissecting and analyzing intricate relationships within the data. It empowers data analysts to explore data from multiple dimensions, facilitating comprehensive exploratory data analysis (EDA) and uncovering intricate interdependencies that underpin the dataset.
Pivot Table
You can use the pivot functionality to arrange the data in a better grid.
Find the total count of fruits by person
Find the total count of fruits
How many row entries for fruits in the table?
Conclusion
The 'groupby' statement in the Pandas DataFrame represents an indispensable tool for data manipulation and exploration, enabling professionals to glean valuable insights, make data-driven decisions, and communicate complex findings in a clear and succinct manner. By utilizing the potential of this powerful operation, analysts can transform raw data into actionable knowledge, propelling their data analysis endeavors to new heights of sophistication and precision.
- Pandas DataFrame Aggregation and Grouping
- How to Sort Pandas DataFrame
- Pandas DataFrame: query() function
- Finding and removing duplicate rows in Pandas DataFrame
- How to Replace NaN Values With Zeros in Pandas DataFrame
- How to read CSV File using Pandas DataFrame.read_csv()
- How to Convert Pandas DataFrame to NumPy Array
- How to shuffle a DataFrame rows
- Import multiple csv files into one pandas DataFrame
- Create new column in DataFrame based on the existing columns
- New Pandas dataframe column based on if-else condition
- How to Convert a Dictionary to Pandas DataFrame
- Rename Pandas columns/index names (labels)
- Check for NaN Values : Pandas DataFrame