Decision Tree | Machine Learning
Decision tree is a popular predictive modeling approach used in Machine Learning for both classification and regression tasks. In a classification problem, the decision tree classifies data points into different classes or categories, while in a regression problem, it predicts continuous numerical values. Decision trees are easy to interpret, and their hierarchical structure makes them useful for understanding complex decision-making processes in data analysis.
How does a decision tree work?
The logic behind decision trees is intuitive and easy to understand due to their tree-like structure. Decision trees classify instances by following a path from the root node to a specific leaf node, where the final classification is determined. At each node in the tree, a test is performed on a specific attribute of the instance, and the branch followed corresponds to one of the possible attribute values. As the instance moves down the tree, it is classified based on the leaf node's assigned classification, making decision trees interpretable and effective for both classification and regression tasks.
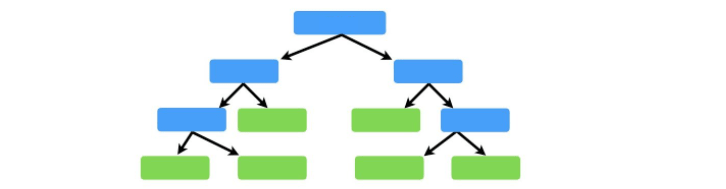
A Decision Tree consists of three types of nodes:
- Root Node – the very top node is called as Root Node or just a Node.
- Decision Node – When a sub-node splits into further sub-nodes, then it is called a decision node.
- Leaf / Terminal Node – Nodes with no children is called Leaf or Terminal node or just leaves.
Decision Tree algorithm
There are many splitting criteria used in Decision trees . The 3 main splitting criteria used in Decision trees are:
- Gini Impurity
- Entropy
- Variance
Gini Impurity
Gini impurity is a measure of the impurity or uncertainty in a set of elements or data points. Specifically, regarding decision trees, it is used to evaluate how often a randomly chosen element from a subset would be misclassified or incorrectly labeled if it was randomly labeled according to the distribution of labels in that subset. Lower Gini impurity indicates higher purity of the subset and better separability of classes, making it a useful criterion for decision tree algorithms to determine the best split and attribute for classification tasks.
Entropy
Entropy is a measure of impurity or uncertainty in a collection of training examples within a dataset. In decision trees and machine learning, it is used to evaluate the homogeneity of a set of data points with respect to their class labels. Lower entropy indicates higher purity, meaning that the data points are more homogeneous and belong to the same class, while higher entropy indicates greater diversity and uncertainty in the class distribution within the dataset. Decision tree algorithms use entropy as a criterion to determine the best attribute and split for classification tasks. Entropy can be calculated as:
where,
- pi is the probability of Y = 1(probability of success of the event).
- qi is the probability of Y = 0 (probability of failure of the event).
Variance
Variance is a method used for splitting nodes in decision trees when the target variable is continuous, such as in regression problems. It is named after the variance measure, which is used as a criterion to decide the feature on which a node should be split into child nodes. The goal is to minimize the variance within each child node, resulting in a better split that reduces the variability of the target variable and improves the regression model's performance.
Python Implementation of Decision Tree
About the Dataset - Kyphosis
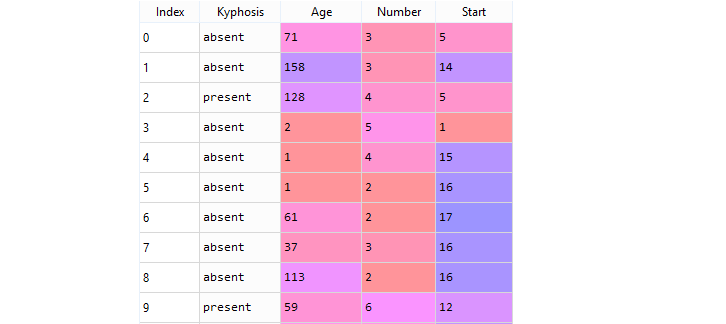
The data frame with 81 rows and 4 columns represents data on patients who have undergone corrective spinal surgery, and the data includes information about the medical condition kyphosis, which causes a forward curving of the back. Kyphosis can occur at any age but is most common in older women. The data likely contains various features related to the patients' condition, treatment, and outcomes, which can be analyzed to gain insights into the effects of the corrective spinal surgery on kyphosis patients.
This file is meant for testing purposes only, download it from here: kyphosis.csv .
This data-frame contains the following columns:
- Kyphosis : A factor with levels absent present indicating if a kyphosis was present after the operation.
- Age : In months.
- Number : The number of vertebrae involved.
- Start : The number of the first vertebra operated on.
Importing Python Libraries
Import data from kyphosis Dataset
Data Pre-Processing
The X variable contains the last three columns (Age, Number, Start) of the dataset while y contains the first column (Kyphosis).
Train Test Split
The above code splits the dataset into 70% train data and 30% test data.
Next step is to fit the model to the training set.
Make predictions and check accuracy
After fit the the training data to the Decision Tree Classifier , the next step is to make predictions on the test data to y_pred vector and find the Accuracy Score.
The decision tree classifier gave an accuracy of 76%.
Confusion Matrix and Classification Report
The final step is to evaluate the model and see how well the model is performing. For that you can use metrics such as confusion matrix.
Above Confusion Matrix shows 6 observations have been classified as false.
Visualize the Tree
You can use Scikit-learn's export_graphviz function to display the tree. For plotting trees, you also need to install the following:
The export_graphviz function converts decision tree classifier into dot file and pydotplus convert this dot file to png.
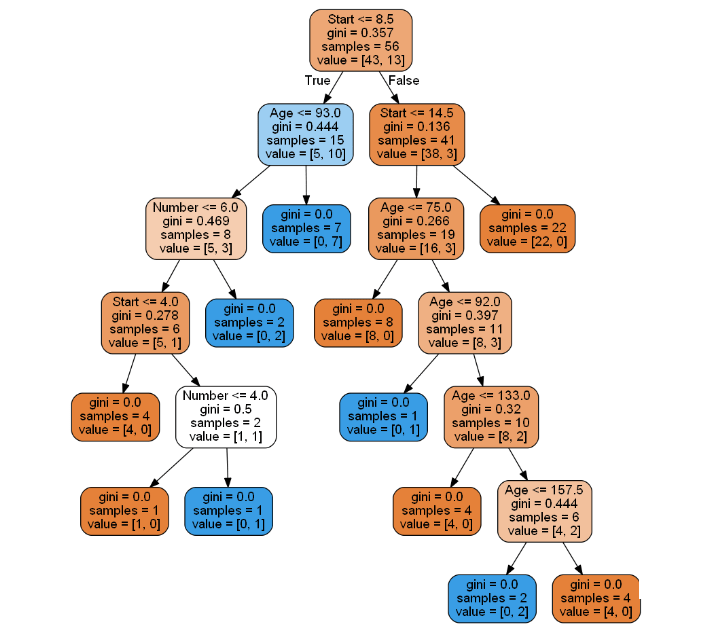
In a decision tree chart, each internal node represents a decision rule that splits the data into subsets based on specific features or attributes. The Gini impurity, often referred to as the Gini ratio, is a measure of impurity at each node, indicating how mixed or impure the node's records are in terms of their class labels. When all records in a node belong to the same class, the node is considered pure, and it becomes a leaf node, meaning it does not require further splitting as it already represents a clear classification. Decision tree algorithms aim to create pure leaf nodes to accurately classify the data points.
Full Source | PythonConclusion
Decision Tree is a powerful supervised learning algorithm used for both classification and regression tasks. It constructs a tree-like model to make predictions by recursively splitting the data into subsets based on decision rules, aiming to create pure leaf nodes that represent clear classifications or regression outcomes. Decision trees are interpretable, intuitive, and widely used in various applications, making them a fundamental tool in machine learning.