Ordinary Least Squares Regression | Python
Machine Learning is all about developing algorithms (models) that can predict output values with an acceptable level of error, using a set of known input parameters. Ordinary Least Squares (OLS) is a popular form of regression used in Machine Learning, particularly in Linear Regression. It seeks to minimize the sum of the squared differences between the actual and predicted values, making it a widely adopted method for fitting a linear model to data and making predictions with it.
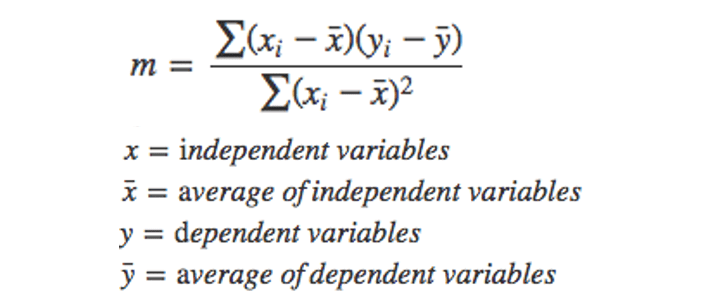
The Ordinary Least Squares (OLS) regression technique is indeed a Supervised Learning algorithm used for estimating unknown parameters in a linear model. Its objective is to create a regression line that minimizes the sum of the squared errors between the observed data and the predicted values. By calculating the squared distance between each data point and the regression line, OLS seeks to find the best-fitting line that minimizes the total sum of squared errors, allowing for accurate predictions and model evaluation.

The Ordinary Least Squares (OLS) method is applicable to both univariate datasets, where there is a single independent variable and a single dependent variable, as well as multivariate datasets, where there is a set of independent variables and a set of dependent variables. An example of a scenario in which one may use OLS (Ordinary Least Squares) is in predicting Food Price from a data set that includes Food Quality and Service Quality.
Ordinary Least Squares Example:
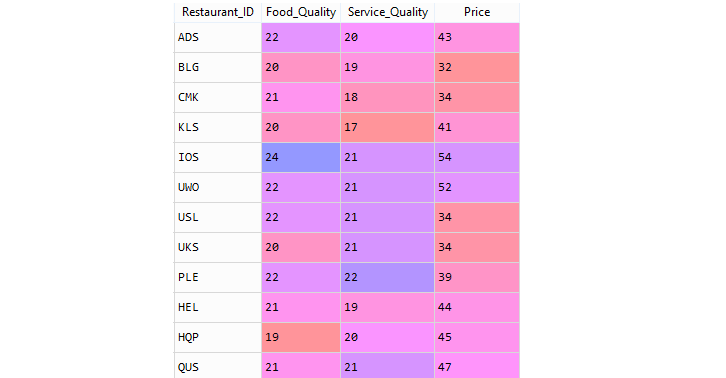
Consider the Restaurant data set: restaurants.csv . A restaurant guide collects several variables from a group of restaurants in a city. The description of the variables is given below:
| Field | Description |
|---|---|
| Restaurant_ID | Restaurant Code |
| Food_Quality | Measure of Quality Food in points |
| Service_Quality | Measure of quality of Service in points |
| Price | Price of meal |
Restaurant data sample,

Loading required Python packages
Importing dataset
The Python Pandas module allows you to read csv files and return a DataFrame object . The file is meant for testing purposes only, you can download it here: restaurants.csv .
From restaurants.csv dataset, use the variable Price of meal ('Price') as your response Y and Measure of Quality Food ('Food_Quality') as our predictor X.
Fit the Model
The statsmodels object has a method called fit() that takes the independent(X ) and dependent(y) values as arguments. Add a constant term so that you fit the intercept of your linear model.
Summary
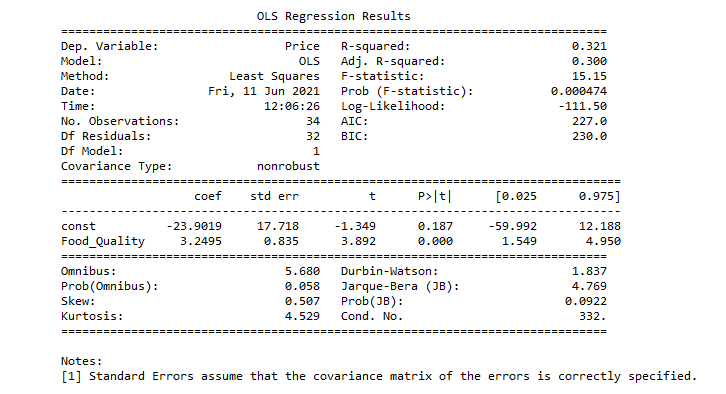
The summary() method is used to obtain a table which gives an extensive description about the regression results.
Full Source | PythonSummary:

Description of some of the terms in the table :
- R-squared - statistical measure of how well the regression line approximates the real data points.
- Adj. R-squared - actually adjusts the statistics based on the number of independent variables present.
- F-statistic - the ratio of mean squared error of the model to the mean squared error of residuals.
- AIC - estimates the relative quality of statistical models for a given dataset.
- BIC - used as a criterion for model selection among a finite set of models.
- coef - the coefficients of the independent variables and the constant term in the equation.
- std err - the basic standard error of the estimate of the coefficient.
- t - a measure of how statistically significant the coefficient is.
- P > |t| - the null-hypothesis that the coefficient = 0 is true.
Conclusion
Ordinary Least Squares (OLS) Regression is a supervised learning technique used to estimate the unknown parameters in a linear regression model. It minimizes the sum of squared errors between the observed data and the predicted values, allowing for accurate predictions and modeling relationships between independent and dependent variables. OLS is a widely used method in data analysis and predictive modeling for both univariate and multivariate datasets, making it a fundamental tool in statistics and machine learning.