Multiple Linear Regression | Python
Multiple Linear Regression (MLR) is an extension of Simple Linear Regression (SLR) that enables the assessment of the relationship between two or more explanatory variables and a single response variable. It accounts for the influence of multiple independent variables on the outcome, making it a powerful tool for modeling and predicting complex relationships in data analysis.
In Simple Linear Regression, the predictive model uses only a single independent variable (also known as the explanatory variable or input variable) to estimate or predict the value of the dependent variable (also known as the response variable or output variable). The relationship between the two variables is represented by a straight line, making it a straightforward technique for understanding the influence of one variable on another and making predictions based on that relationship. With Simple Linear Regression model your data as follows:
y(pred) = b0 + b1 * xThis is a line where y(pred) is the output variable you want to predict, x is the input variable and b0 and b1 are coefficients that you need to estimate that move the line around.
Multiple Linear Regression
Multiple Linear Regression is a machine learning technique that establishes the relationship between a single dependent variable and a set of two or more independent variables. It extends the concept of Simple Linear Regression to handle multiple predictors, allowing for a more comprehensive understanding of how a combination of independent variables influences the dependent variable. The model estimates the coefficients for each independent variable to identify their individual impact on the dependent variable while considering their combined effects.
Let's take an example:
Imagine that you are a tourist guide. You need to provide the price range of food to your clients. The price of those food usually correlates with the Food Quality and Service Quality of the Restaurant. The bigger they are, the more expensive the food was.
Above example explains a linear relationship exists when increasing or decreasing the independent variable(s) results in a corresponding increase or decrease of the dependent variable.
In Multiple Linear Regression , with 'n' predictor variables (x), the prediction of y(pred) is expressed by the following equation:
y(pred) = b0 + b1x1 + b2x2 + .... + bn * xnHere, y(pred) is the variable that you are trying to predict, x's are the variables that you are using to predict y(pred), b0 is the intercept, and b's are the regression coefficients.
Multiple linear regression Example:
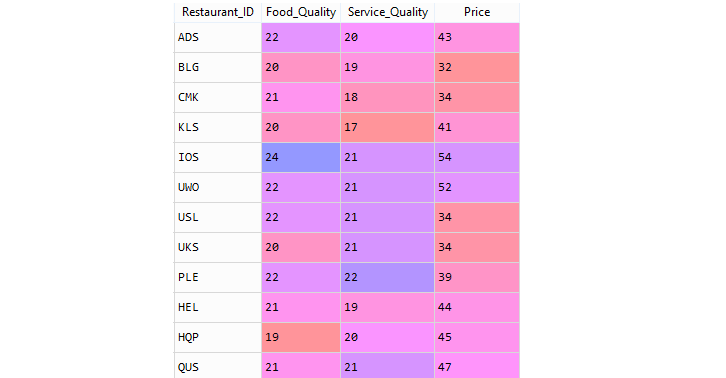
Consider the Restaurant data set: restaurants.csv . A restaurant guide collects several variables from a group of restaurants in a city. The description of the variables is given below:
| Field | Description |
|---|---|
| Restaurant_ID | Restaurant Code |
| Food_Quality | Measure of Quality Food in points |
| Service_Quality | Measure of quality of Service in points |
| Price | Price of meal |
Restaurant data sample,
Loading required Python packages
Importing dataset
The Python Pandas module allows you to read csv files (read_csv()) and return a DataFrame object . The file is meant for testing purposes only, you can download it from here: restaurants.csv .
Identifying the dependent(y) and independent variables(X) .
Define the Model
Next step is to define the Linear Regression model . So, you have a variable named "regr" and assign it an instance of the Linear Regression class imported from sklearn.
Fit the Model
The "regr" object has a method called fit() that takes the independent(X) and dependent(y) values as arguments and fills the regression object with data that describes the relationship:
Predict
Now you have a regression object that are ready to predict Food Price based on a Restaurant's Food_Quality and Service_Quality . So, next step is to predict the Food Price of a Restaurant where Food_Quality 25 points and Service Quality is 22 points.
Full Source | Python
Above result shows that a Restaurant with Food Quality 25 points and Service qulity 22 points, will charge the Food price 56.956.
Coefficient
The coefficient refers to a factor or weight that quantifies the relationship between an independent variable and the dependent variable in a predictive model. These coefficients represent the strength and direction of the influence of each independent variable on the dependent variable. They are often estimated during the model training process, and their values help in interpreting the significance and impact of different features on the target variable, making them essential components in understanding and making predictions with the model.
For example: if x is a variable, then 2x is x two times. x is the unknown variable, and the number 2 is the coefficient.
Next step is to find out the coefficient value of Food_Quality against Price, and for Service_Quality against Price. The Results you get explain what would happen if you increase, or decrease, one of the independent values.
Find the Coefficient values of the regression object:
The result values represents the Coefficient values of Food_Quality and Service_Quality.
- Food_Quality : 3.02723464
- Service_Quality : 0.26606145
Above coefficient values explains that if the Food_Quality increase by 1 point, the Price increases by 3.02723464. Also if the Service_Quality increases by 1 point, the Price emission increases by 0.26606145.
So, let's test it now!You have already predicted that if Food_Quality with a 25 points and Service_Quality with a 22 points, the Price will be approximately 56.956.
Now, you can test it if you increase the Food_Quality with 10 points (25+10 = 35).
The above code predicted that a Restaurant with Food_Quality 35 points and Service_Quality with 22 points will charge the Food Price approximately 87.228.
Which shows that the Coefficient of 3.02723464 is correct:
56.95600559 + (10 * 3.02723464) = 87.2283Where,
- 56.95600559 is the Predicted Food Price when Food_Quality 25 points.
- 10 is the increased Food_Quality points.
- 3.02723464 is the Coefficient Value of Food_Quality.
Conclusion
Multiple Linear Regression is a powerful machine learning technique that assesses the relationship between a single dependent variable and a set of two or more independent variables. By extending the concept of Simple Linear Regression, it allows for modeling and predicting complex relationships, considering the combined effects of multiple predictors on the outcome variable. The model estimates coefficients for each independent variable, providing valuable insights into the influence of each feature on the dependent variable, making it a widely used tool in data analysis and prediction tasks.