K-Nearest Neighbor(KNN) | Python
K Nearest Neighbor (KNN) algorithm is indeed a versatile supervised learning technique used for both classification and regression tasks, although it is more commonly applied to classification problems. KNN is popular in real-life scenarios due to its non-parametric nature, meaning it does not assume any specific distribution of data. This flexibility makes KNN well-suited for various applications where the underlying data distribution may not be well-defined or known.
How K-Nearest Neighbor works?
The K Nearest Neighbor (KNN) algorithm operates based on the principle of feature similarity. When classifying a new data point, KNN considers how closely its features resemble the training set instances. In classification tasks, the output class is determined by the majority class among the K-most similar instances from the training set. Each neighboring instance effectively casts a "vote" for its class, and the class with the highest number of votes becomes the prediction for the new data point. This voting mechanism makes KNN a simple yet effective algorithm for solving classification problems based on the concept of feature similarity.
Example
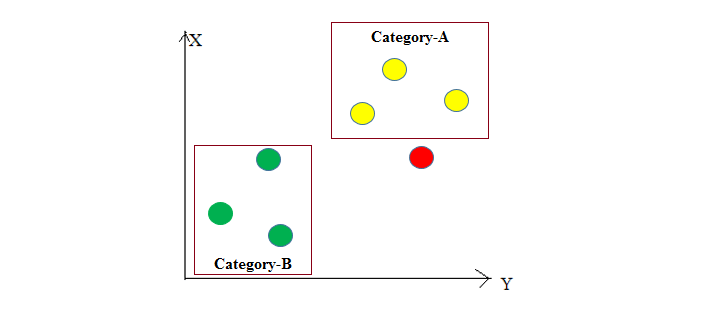
In the given dataset, the K Nearest Neighbor (KNN) algorithm is applied to predict the class of the red data point. It starts by calculating the distances between the red data point and all the other data points in the dataset. In this case, K=3 is specified, so the algorithm finds the 3 nearest yellow data points with the least distance to the red data point.
Since all the nearest neighbors are yellow data points (belonging to 'Category-A'), the KNN algorithm predicts that the red data point also belongs to 'Category-A'. This is because the majority of the K-nearest neighbors are from 'Category-A', so the red data point is classified into that category. The KNN algorithm makes predictions based on the class of the most similar data points in the feature space, making it a simple yet effective classification method.
Python implementation of the KNN algorithm
Importing Libraries
Importing the Dataset (Iris data)
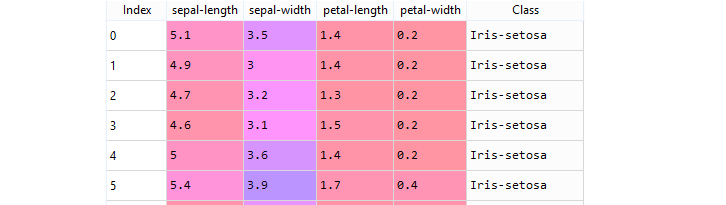
It is a dataset that measures sepal-length, sepal-width, petal-length, and petal-width of three different types of iris flowers: Iris setosa, Iris virginica, and Iris versicolor. The task is to predict the "Class" to which these plants belong. To import the dataset and load it into our pandas dataframe , execute the following code:
Assign colum names to the dataset
Read dataset to pandas dataframe .
Sample dataset
Data Pre-Processing
The X variable contains the first four columns of the dataset while y contains the labels.
Train Test Split
The above code splits the dataset into 60% train data and 40% test data .
Scale the Features
Before making any actual predictions , it is always a good practice to scale the features so that all of them can be uniformly evaluated.
Fitting K-NN classifier to the Training data
Next step is to fit the K-NN classifier to the training data.
Predicting the Test Result
The final step is to make predictions on the test data to y_pred vector.
Confusion Matrix and Classification Report
Create the Confusion Matrix and Classification Report for your K-NN model to see the accuracy of the classifier.
The Above results show that your KNN algorithm was able to classify all the 60 records in the test set with 96% accuracy. Although the algorithm performed very well with this dataset , don't expect the same results with all applications.
Full Source | Python
Conclusion
K-Nearest Neighbor (KNN) is a versatile supervised learning algorithm used for both classification and regression tasks. It operates based on the principle of feature similarity, making predictions by finding the K-most similar data points from the training set and assigning the class based on majority voting (for classification) or averaging (for regression). KNN is a non-parametric method that does not assume underlying data distributions, making it widely used and applicable to various real-life scenarios.