Logistic Regression | Python
Classification is a vital area in supervised machine learning, where the goal is to predict the class or category of an entity based on its features. Logistic Regression is a widely used classification algorithm that specializes in predicting discrete values, such as binary outcomes like 0 or 1, Spam or Not spam, and so on. It is a fundamental tool in Data Science, with a significant portion of classification problems encountered in real-world applications.
The following article implemented a Logistic Regression model using Python and scikit-learn. Using a "students_data.csv " dataset and predicted whether a given student will pass or fail in an exam based on three relevant study features.
About the Dataset
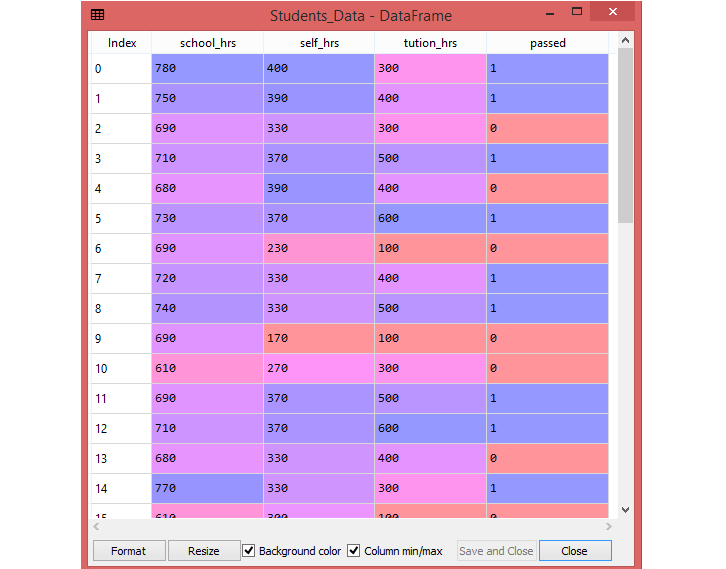
The students_data.csv dataset has three features—namely, school_hrs, self_hrs and tution_hrs. The school_hrs indicates how many hours per year the student studies at school, self_hrs indicates how many hours per year the student studies at home, and tution_hrs indicates how many hours per year the student is taking private tuition classes.
Apart from these three features, there is one label in the dataset named "passed ". This label has two values—either 1 or 0. The value of 1 indicates pass and a value of 0 indicates fail.
The file is meant for testing purposes only, you can download it from here: students_data.csv .
Logistic Regression example | Python
Here, you can build a Logistic Regression using:
- The dependent variable "passed" represents whether a student passed or not.
- The 3 independent variables are the school_hrs, self_hrs and tution_hrs.
Import Python packages
Importing the Data Set into Python Script
Here, you are going to do is to read in the dataset using the Pandas' read_csv() function.
Extracted the dependent (Y) and independent variable(X) from the dataset.
Building a Logistic Regression Model
Next step is to apply train_test_split . In this example, you can set the test size to 0.25, and therefore the model testing will be based on 25% of the dataset, while the model training will be based on 75% of the dataset.
At this stage, you ready to create your logistic regression model . You can do this using the LogisticRegression class you imported in the beginning.
Training the Logistic Regression Model
Once the model is defined, you can work to fit your data . So, the next step is to fit method on the model to train the data.
Making Predictions With Logistic Regression Model
Once model training is complete, its time to predict the data using the model. So, you can store the predicted values in the y_pred variable.
For the testing purpose later, print the X_test and y_pred .
Print y_pred .
The "students_data.csv" has 40 observations . Since you set the test size to 0.25, then the prediction displayed the results for 10 records (40*0.25=10, where 1 = passed, while 0 = failed).
Then, use the code below to get the Confusion Matrix :
Confusion Matrix
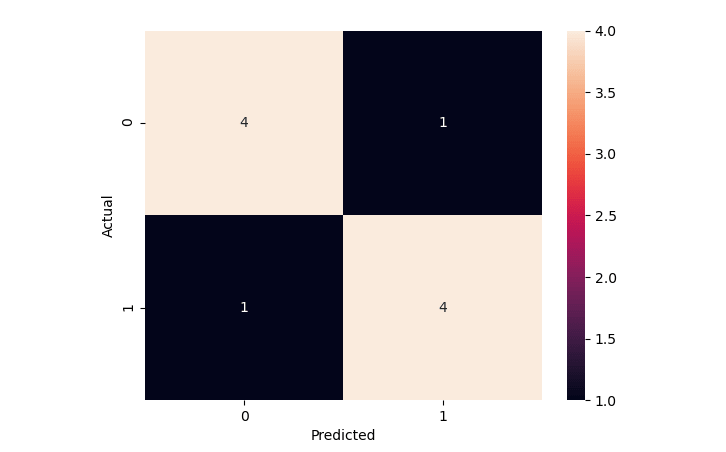
Above Confusion Matrix shows:
- True Positives (TP) = 4
- True Negatives (TN) = 4
- False Positives (FP) = 1
- False Negatives (FN) = 1
From the above data, you can calculate the Accuracy manually:
Accuracy = (TP+TN)/Total = (4+4)/10 = 0.8Accuracy Percentage = 100 * 0.8 = 80%
Finding Accuracy using Python
You can find the accuracy of your model in order to evaluate its performance. For this, you can use the accuracy_score method of the metrics class, as shown below:
The result shows that accuracy of the model is 80.0 % . By accuracy, you mean the number of correct predictions divided by the total number of predictions.
Full Source | PythonChecking the Prediction
The confusion matrix displayed the results for 10 records (40*0.25). These are the 10 test records:
The prediction was also made for those 10 records (where 1 = passed, while 0 = failed):
From the following table you can confirm that you got the correct results 8 out of 10 .
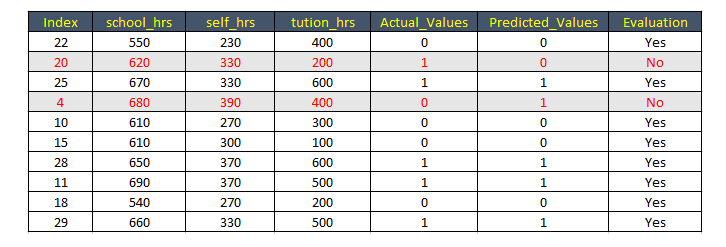
From the above table, you can confirm that the result matching with the accuracy level of 80% .
Conclusion
Logistic Regression is a popular and powerful classification algorithm in supervised machine learning. It is used to predict binary outcomes and assign probabilities to discrete categories, making it well-suited for various applications such as spam detection, medical diagnosis, and customer churn prediction.