What is GTmetrix?
Speed plays a crucial role in SEO, as slow website speed can lead to higher bounce rates and dissatisfied users. To enhance website speed, it is essential to utilize available free tools like GTMetrix, which provides detailed performance reports. By utilizing a combination of Google PageSpeed Insights and YSlow, GTMetrix delivers accurate scores and valuable recommendations to optimize website performance effectively.
GTmetrix, developed by GT.net, a hosting company in Vancouver, Canada, is a valuable tool for SEO and developers alike. It provides detailed insights into a website's performance, allowing users to identify areas for improvement. By assessing Google PageSpeed and YSlow metrics, GTmetrix assigns a grade from F to A, providing a comprehensive analysis of website optimization. However, it's important to note that the scores may not always be 100% accurate, as external factors like internet connection quality or high visitor traffic can impact the results. Nonetheless, GTmetrix remains a powerful tool to enhance website speed and overall performance.
How to use GTMetrix ?
To run a GTMetrix performance report for your website, follow these steps:
- Use your browser to go to https://gtmetrix.com.
- In the text box, type the URL for your web site:

- Click "Test your site". GTMetrix analyzes your site.
The duration of the analysis on GTmetrix can vary based on the current website's activity and the speed of your own site. The process may take anywhere from a few seconds to a minute to complete, depending on the workload of the GTmetrix website and the complexity of your site's performance. It's essential to be patient during the analysis and consider external factors that might affect the processing time. The accuracy and depth of the insights provided by GTmetrix make the brief wait worthwhile for optimizing website performance.
After GTMetrix completes the analysis of your website, it displays a performance report for your site.
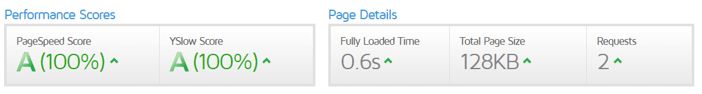
The page details are the most important and immediate info you can have on your website performance:
Fully Loaded Time
The length of time required for your page to become interactive in the test browser , expressed in seconds.
Total Page Size
The total amount of data downloaded to the test server, in MB, including all media assets such as images.
Requests
This the number of individual HTTP requests generated by your site via scripts, CSS, etc.
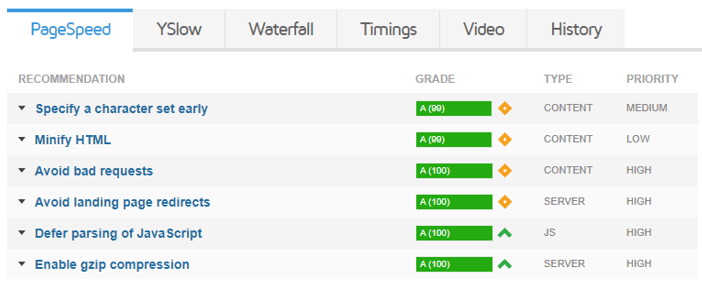
GTMetrix's reports are divided into five different sections including PageSpeed, YSlow, waterfall breakdown, video, and history.
The individual tabs under the performance summary area in the gtmatrix results , are where you can see what specific areas your website is performing well, or poorly, in.
Pagespeed
The Pagespeed section of GTmetrix provides fundamental insights and identifies easy-to-implement optimizations to improve your site's loading speed. Recommendations are categorized using a lettering system, ranging from A to F, indicating their effectiveness from best to poor. The Type column specifies the content or area to which each recommendation pertains (e.g., Content, Server, JavaScript), and the Priority column assigns a level of importance (High, Medium, or Low) for each issue's impact on the overall performance. This section serves as a starting point for addressing key areas and enhancing website speed.
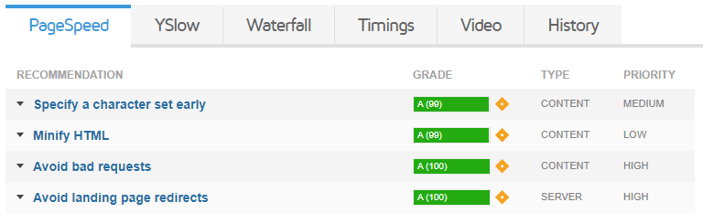
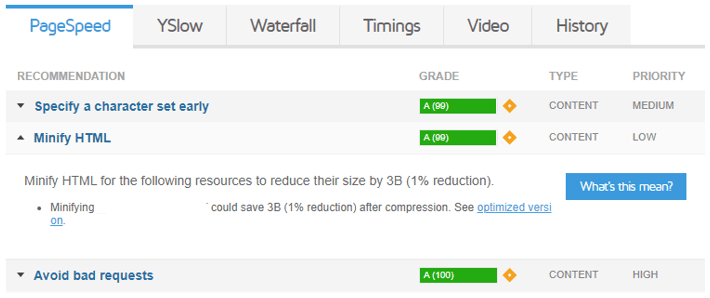
Using the small arrow on the left hand size of each recommendation , you can expand the section.
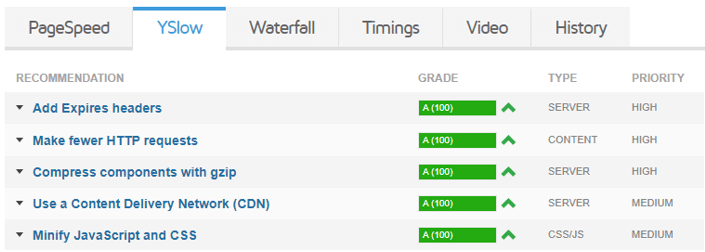
YSlow
YSlow, the following category of results in GTmetrix, complements the Pagespeed test by identifying crucial factors contributing to your website's slow performance. It offers valuable recommendations to optimize your page's speed and presents detailed statistics relating to the page's components. This section provides a comprehensive summary of various page elements, enabling you to focus on specific areas for improvement and enhance overall website performance.
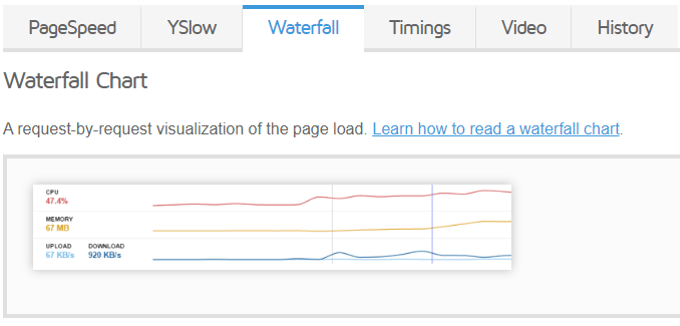
Waterfall
The Waterfall chart in GTmetrix presents a comprehensive breakdown of every request made by your website, encompassing media files, JavaScript, CSS, and more. It offers a visual representation of the loading behavior of your site, displaying the order in which each resource is requested and loaded. This chart provides detailed insight into every script, media file, and third-party resource utilized by your page, enabling you to analyze loading times and optimize the loading sequence for improved website performance.
Timings
The timings tab displays some advanced results, these events include:
- Redirect duration
- Connect duration
- Backend duration
- Time to First Byte (TTFB)
- First paint time
- DOM interactive time
- DOM content loaded time (and JavaScript event duration)
- Onload time (and JavaScript event duration)
- RUM Speed Index
GTmetrix's unique timeline visualization offers a chronological representation of event occurrences, providing a clear overview of their sequence. The events are presented in order, allowing users to quickly identify when they take place during page loading. However, the timeline is not necessarily drawn to scale because webpages can exhibit significant variations in event durations, ranging from substantial to negligible differences between events. This visualization aids in identifying bottlenecks and areas for optimization during the loading process, despite not being strictly proportional.
Video
The video option in GTmetrix is a valuable feature accessible to registered users. It provides a comprehensive video breakdown of your website's loading process, showcasing the key milestones analyzed in the Timings tab. This video allows users to visually observe the loading sequence and identify specific areas where improvements can be made to enhance website performance. It offers a dynamic and informative perspective on the loading behavior of the site, making it a useful tool for optimizing overall user experience.
History
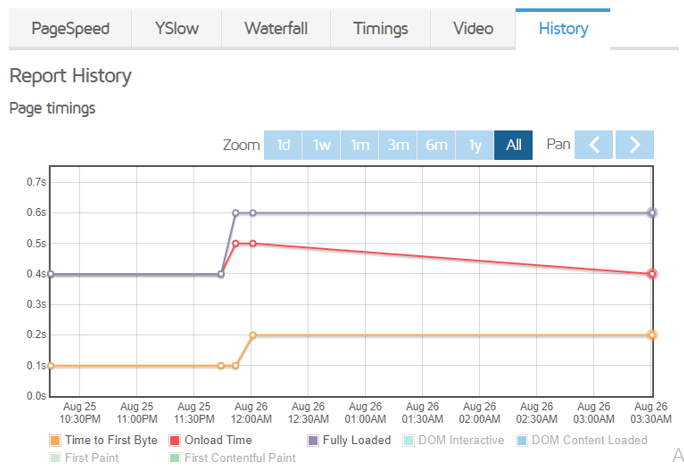
GTmatrix History tab contains all of the graphs that were previously under the "Performance History" tab, also added tool tips to the nodes that allow you to:
- View the highlighted report (if you're not already viewing it)
- Compare the highlighted report to the currently viewed report
- Delete the highlighted report
- This provides our users with a more visual way of keeping track of past reports.
Conclusion
GTmetrix is indeed a valuable gem for website optimization, offering a comprehensive solution to enhance site performance. Instead of relying on separate tools like YSlow extension or Google Webmaster Tools for specific performance metrics, GTmetrix provides an all-in-one platform to assess both YSlow and Google Page Speed scores. This streamlined approach saves time and effort for users, making GTmetrix a go-to tool for optimizing websites and improving overall performance in a convenient and efficient manner.
- How to Print Screen
- How to View Hidden Files in Windows 11, 10, 8 and 7
- Fahrenheit to Celsius Temperatire Conversion Formula
- How to zip files - Compress and uncompress files
- How to Use Robocopy
- How to WMIC ?
- How to recover deleted files
- Microsoft Outlook POP3 Settings, Microsoft Outlook IMAP Settings
- How to Update Windows 11
- What is Three-Tier Architecture ?
- What Is an API (Application Program Interface) ?
- Differences Between HTML4 And HTML5
- How to choose the best antivirus software
- How to Embed a YouTube Video in Your Website
- what is the difference between x64 and x86
- Learn Multiplication of Tables
- What is a Proxy Server?
- How to use a Google Android phone as a Wi-Fi hotspot
- How to automatically redirect a Web Page to another URL
- How to Download YouTube Videos
- What is a Phishing Attack ? How can I avoid them?
- What is a Call To Action?
- What's the Difference Between JPG and PNG?
- What Is a "500 Internal Server Error" and How Do I Fix It?
- What is the difference between OTF and TTF fonts
- How to enable flash player on chrome
- How to Select a Video Editing Software
- Why am I getting a "Your connection is not private error" in Chrome
- How to block "Deceptive site ahead" security error?
- Crypto for beginners: What is cryptocurrency?
- What is Bitcoin and how does it work?
- How to fix HTTP Error 502 Bad gateway
- GET url returns "data:text/html,chromewebdata"
- Chrome:Your Clock Is Ahead / Your Clock Is Behind Error
- How to fix ERR_UNKNOWN_URL_SCHEME
- SSL Error on Port 443
- How to Fix This Site Can't Be Reached Error in Chrome
- A disk read error occurred, Press Ctrl+Alt+Del to restart
- How to use System Restore on Windows 10
- What is HTTP error 503 and how do you fix it?
- How to get help in Windows 10
- How To Disable Windows 10 Forced Updates
- How to Fix Google Chrome Error - ERR_SSL_PROTOCOL_ERROR
- How to reset windows 10 password
- What is Blockchain?
- How To Fix: ERR_PROXY_CONNECTION_FAILED
- Unable to send mail through smtp.gmail.com
- How to fix DNS_PROBE_FINISHED_NXDOMAIN
- How to fix System Thread Exception Not Handled Error
- How to fix ERR_INTERNET_DISCONNECTED Error
- WiFi Connected But No Internet Access – How to Fix?
- How to fix a HTTP Error 400: Bad Request?
- What is Deprecation
- How to Fix a 403 Forbidden Error
- What is the maximum length of a URL in different browsers?
- SSL Certificate Problem: Unable to get Local Issuer Certificate
- How to Fix the ERR_CONNECTION_TIMED_OUT Error
- What does localhost:8080 mean?
- How to reduce initial server response time
- 414 Request-URI Too Long - HTTP
- Message channel closed before a response was received