What is a stacktrace?
A stack trace is a textual representation of the sequence of method calls that led to an exceptional condition, such as an exception being thrown or an error occurring. It provides valuable information about the execution flow of a program at the time of the exception.
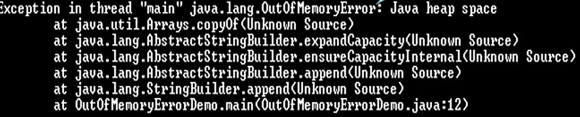
Java Stack Trace
When an exception occurs, Java captures the state of the call stack at that point and generates a stack trace. The stack trace contains a list of method calls, starting from the method that threw the exception and going back to the initial method that triggered the execution. Each method in the stack trace is accompanied by its corresponding class, method name, and line number where the method was invoked.
The stack trace serves as a diagnostic tool, offering insights into the runtime behavior of the program. It helps developers identify the root cause of an exception by pinpointing the exact location in the code where the exceptional condition originated. By examining the stack trace, developers can trace the sequence of method invocations, analyze the state of variables, and identify any potential issues or errors in the code.
The stack trace is printed to the console by default when an exception is thrown unless it is explicitly caught and handled. It can also be programmatically accessed and utilized within the exception handling code. Additionally, stack traces can be logged or saved to facilitate debugging and troubleshooting processes.
Conclsuion
By carefully examining the stack trace, developers can gain valuable insights into the flow of their program, identify problematic areas, and take appropriate actions to address exceptions or errors. It is an essential tool for diagnosing and resolving issues in Java applications.
- Java Interview Questions-Core Faq - 1
- Java Interview Questions-Core Faq - 2
- Java Interview Questions-Core Faq - 3
- Features of Java Programming Language (2026)
- Difference between Java and JavaScript?
- What is the difference between JDK and JRE?
- What gives Java its 'write once and run anywhere' nature?
- What is JVM and is it platform independent?
- What is Just-In-Time (JIT) compiler?
- What is the garbage collector in Java?
- What is NullPointerException in Java
- Difference between Stack and Heap memory in Java
- How to set the maximum memory usage for JVM?
- What is numeric promotion?
- Generics in Java
- Static keyword in Java
- What are final variables in Java?
- How Do Annotations Work in Java?
- How do I use the ternary operator in Java?
- What is instanceof keyword in Java?
- How ClassLoader Works in Java?
- What are fail-safe and fail-fast Iterators in Java
- What are method references in Java?
- "Cannot Find Symbol" compile error
- Difference between system.gc() and runtime.gc()
- How to convert TimeStamp to Date in Java?
- Does garbage collection guarantee that a program will not run out of memory?
- How setting an Object to null help Garbage Collection?
- How do objects become eligible for garbage collection?
- How to calculate date difference in Java
- Difference between Path and Classpath in Java
- Is Java "pass-by-reference" or "pass-by-value"?
- Difference between static and nonstatic methods java
- Why Java does not support pointers?
- What is a package in Java?
- What are wrapper classes in Java?
- What is singleton class in Java?
- Difference between Java Local Variable, Instance Variable and a Class Variable?
- Can a top level class be private or protected in Java
- Are Polymorphism , Overloading and Overriding similar concepts?
- Locking Mechanism in Java
- Why Multiple Inheritance is Not Supported in Java
- Why Java is not a pure Object Oriented language?
- Static class in Java
- Difference between Abstract class and Interface in Java
- Why do I need to override the equals and hashCode methods in Java?
- Why does Java not support operator overloading?
- Anonymous Classes in Java
- Static Vs Dynamic class loading in Java
- Why am I getting a NoClassDefFoundError in Java?
- How to Generate Random Number in Java
- What's the meaning of System.out.println in Java?
- What is the purpose of Runtime and System class in Java?
- The finally Block in Java
- Difference between final, finally and finalize
- What is try-with-resources in java?
- Why String is immutable in Java ?
- What are different ways to create a string object in Java?
- Difference between String and StringBuffer/StringBuilder in Java
- Difference between creating String as new() and literal | Java
- How do I convert String to Date object in Java?
- How do I create a Java string from the contents of a file?
- What actually causes a StackOverflow error in Java?
- Why is char[] preferred over String for storage of password in Java
- What is I/O Filter and how do I use it in Java?
- Serialization and Deserialization in Java
- Understanding transient variables in Java
- What is Externalizable in Java?
- What is the purpose of serialization/deserialization in Java?
- What is the Difference between byte stream and Character streams
- How to append text to an existing file in Java
- How to convert InputStream object to a String in Java
- What is the difference between Reader and InputStream in Java
- Introduction to Java threads
- Synchronization in Java
- Static synchronization Vs non static synchronization in Java
- Deadlock in Java with Examples
- What is Daemon thread in Java
- Implement Runnable vs Extend Thread in Java
- What is the volatile keyword in Java
- What are the basic interfaces of Java Collections Framework
- Difference between ArrayList and Vector | Java
- What is the difference between ArrayList and LinkedList?
- What is the difference between List and Set in Java
- Difference between HashSet and HashMap in Java
- Difference between HashMap and Hashtable in Java?
- How does the hashCode() method of java works?
- Difference between capacity() and size() of Vector in Java
- What is a Java ClassNotFoundException?
- How to fix java.lang.UnsupportedClassVersionError